
Data · Updated November 2026
San Diego Beach Water Quality: Bacteria Results by Beach
Imperial Beach municipal beach had the most frequent bacteria exceedances of any regularly sampled San Diego County beach in the 12 months to October 27, 2026: 98 of 133 sample days (73.7%) were above California’s single-sample health standards, followed by North Imperial Beach at 68.4%. 7 beaches had no exceedances at all, including Mission Beach, Sunset Cliffs Park, Fletcher Cove, Solana Beach City Beaches and Marine Street Beach.
Countywide, 533 of 3,338 station sample days (16.0%) exceeded a standard. These are past lab results from 95 County monitoring stations, not today’s conditions: check the County’s official beach status before you swim.
- No exceedances
- Under 5%
- 5–15%
- 15–40%
- 40% or more
- Partial-year data
Pin color = share of sample days above a California standard. Select a pin for the numbers.
Map data © OpenStreetMap contributors.
Which San Diego beaches exceed bacteria standards most often?
- The border beaches dominate. The 4 regularly sampled Imperial Beach and border beaches were above a standard on 273 of 459 sample days (59.5%). North County beaches were at 3.5% across 1,081 sample days.
- Ocean Beach & Point Loma had the cleanest record of any stretch with 100+ samples: 7 of 413 days (1.7%).
- Winter runs higher. Across culture-tested samples over the last two years, November–March sample days were above a standard 10.7% of the time, against 4.8% for May–September. The worst month was February 2026 (15.4%); the best was August 2025 (2.5%).
| # | Beach (stations) | Area | Days above / sampled | Rate | Latest sample | Last exceedance | Nearest NOAA tides |
|---|---|---|---|---|---|---|---|
| 1 | Imperial Beach municipal beachEH-010, IB-050 | Imperial Beach & border | 98 / 133 | 73.7% | Oct 13, 2026 · above | Oct 13, 2026 | Imperial Beach |
| 2 | North Imperial BeachIB-060 | Imperial Beach & border | 67 / 98 | 68.4% | Oct 13, 2026 · above | Oct 13, 2026 | Imperial Beach |
| 3 | Tijuana Slough National Wildlife RefugeIB-030, IB-040 | Imperial Beach & border | 73 / 114 | 64.0% | Oct 13, 2026 · above | Oct 13, 2026 | Imperial Beach |
| 4 | Border Field State ParkIB-010, IB-020 | Imperial Beach & border | 35 / 114 | 30.7% | Oct 13, 2026 · above | Oct 13, 2026 | Imperial Beach |
| 5 | Silver Strand State BeachIB-070 | Coronado & Silver Strand | 23 / 82 | 28.0% | Oct 13, 2026 · above | Oct 13, 2026 | Imperial Beach |
| 6 | Coronado north beachEH-060 | Coronado & Silver Strand | 10 / 63 | 15.9% | Oct 5, 2026 · within standards | Dec 31, 2025 | Imperial Beach |
| 7 | San Diego Bay Shelter IsEH-200 | San Diego Bay | 7 / 50 | 14.0% | Oct 19, 2026 · within standards | Sep 10, 2026 | San Diego Bay (Broadway) |
| 8 | South Casa BeachEH-305, EH-310 | La Jolla & Torrey Pines | 10 / 81 | 12.3% | Oct 20, 2026 · within standards | Sep 9, 2026 | La Jolla (Scripps Pier) |
| 9 | Moonlight BeachEH-420 | North County | 5 / 50 | 10.0% | Oct 26, 2026 · within standards | Sep 28, 2026 | La Jolla (Scripps Pier) |
| 10 | Coronado City beachesIB-080 | Coronado & Silver Strand | 4 / 57 | 7.0% | Oct 13, 2026 · above | Oct 13, 2026 | Imperial Beach |
| 11 | Oceanside municipal beachOC-010, OC-020, OC-040 | North County | 9 / 162 | 5.6% | Oct 19, 2026 · within standards | Oct 13, 2026 | La Jolla (Scripps Pier) |
| 12 | Buccaneer BeachOC-030 | North County | 3 / 54 | 5.6% | Oct 19, 2026 · within standards | Oct 13, 2026 | San Clemente |
| 13 | Harbor BeachOC-100, OC-110 | North County | 3 / 54 | 5.6% | Oct 27, 2026 · within standards | May 19, 2026 | San Clemente |
| 14 | Oceanside Pier areaOC-050, OC-080 | North County | 3 / 55 | 5.5% | Oct 19, 2026 · within standards | Oct 13, 2026 | San Clemente |
| 15 | Tourmaline Surfing ParkEH-254, FM-030 | Pacific Beach & Mission Beach | 3 / 58 | 5.2% | Oct 19, 2026 · within standards | Dec 4, 2025 | La Jolla (Scripps Pier) |
| 16 | Dog Beach, O.B.FM-010 | Ocean Beach & Point Loma | 2 / 45 | 4.4% | Oct 27, 2026 · within standards | Apr 23, 2026 | La Jolla (Scripps Pier) |
| 17 | San Diego Bay Coronado CaysEH-070 | San Diego Bay | 2 / 48 | 4.2% | Oct 19, 2026 · within standards | Dec 18, 2025 | San Diego Bay (Broadway) |
| 18 | San Dieguito River BeachEH-380 | North County | 2 / 50 | 4.0% | Oct 20, 2026 · within standards | Oct 19, 2026 | La Jolla (Scripps Pier) |
| 19 | La Jolla Shores BeachEH-320, EH-330, EH-340, FM-080 | La Jolla & Torrey Pines | 6 / 169 | 3.6% | Oct 20, 2026 · within standards | Aug 11, 2026 | La Jolla (Scripps Pier) |
| 20 | Cardiff State BeachSE-030, SE-040, SE-050, SE-060 | North County | 5 / 163 | 3.1% | Oct 20, 2026 · within standards | Dec 23, 2025 | La Jolla (Scripps Pier) |
| 21 | Torrey Pines State BeachFM-100 | La Jolla & Torrey Pines | 1 / 50 | 2.0% | Oct 20, 2026 · within standards | Dec 10, 2025 | La Jolla (Scripps Pier) |
| 22 | Ocean BeachPL-080, PL-090, PL-100, PL-110 | Ocean Beach & Point Loma | 4 / 211 | 1.9% | Oct 14, 2026 · within standards | Sep 23, 2026 | La Jolla (Scripps Pier) |
| 23 | Point Loma restricted-access shorelinePL-040, PL-050 | Ocean Beach & Point Loma | 1 / 105 | 1.0% | Oct 14, 2026 · within standards | Aug 5, 2026 | Imperial Beach |
| 24 | San Elijo State BeachEH-400, SE-070 | North County | 1 / 101 | 1.0% | Oct 20, 2026 · within standards | Jul 14, 2026 | La Jolla (Scripps Pier) |
| 25 | WindanSea BeachEH-260, EH-280, FM-050 | La Jolla & Torrey Pines | 1 / 117 | 0.9% | Oct 19, 2026 · within standards | Sep 30, 2026 | La Jolla (Scripps Pier) |
| 26 | South Carlsbad State BeachEH-440, EN-010, EN-020, EN-030, EN-040, EN-050 | North County | 1 / 240 | 0.4% | Oct 19, 2026 · within standards | Feb 23, 2026 | La Jolla (Scripps Pier) |
| 27 | Fletcher CoveSE-010 | North County | 0 / 50 | 0% | Oct 20, 2026 · within standards | none in 24 months | La Jolla (Scripps Pier) |
| 28 | Marine Street BeachEH-290 | La Jolla & Torrey Pines | 0 / 39 | 0% | Oct 19, 2026 · within standards | Mar 19, 2025 | La Jolla (Scripps Pier) |
| 29 | Mission BeachPL-120 | Pacific Beach & Mission Beach | 0 / 54 | 0% | Oct 14, 2026 · within standards | none in 24 months | La Jolla (Scripps Pier) |
| 30 | Pacific BeachEH-250 | Pacific Beach & Mission Beach | 0 / 39 | 0% | Oct 19, 2026 · within standards | none in 24 months | La Jolla (Scripps Pier) |
| 31 | Solana Beach City BeachesSE-020 | North County | 0 / 50 | 0% | Oct 20, 2026 · within standards | none in 24 months | La Jolla (Scripps Pier) |
| 32 | Sunset Cliffs ParkPL-070 | Ocean Beach & Point Loma | 0 / 52 | 0% | Oct 14, 2026 · within standards | none in 24 months | La Jolla (Scripps Pier) |
| 33 | Whispering Sands Nicholson PointEH-300 | La Jolla & Torrey Pines | 0 / 39 | 0% | Oct 19, 2026 · within standards | none in 24 months | La Jolla (Scripps Pier) |
Water quality by area
| Area | Stations | Days above / sampled | Rate |
|---|---|---|---|
| Imperial Beach & border | 8 | 321 / 509 | 63.1% |
| Coronado & Silver Strand | 7 | 118 / 354 | 33.3% |
| Mission Bay | 17 | 13 / 52 | 25.0% |
| San Diego Bay | 5 | 10 / 108 | 9.3% |
| North County | 30 | 38 / 1081 | 3.5% |
| La Jolla & Torrey Pines | 16 | 23 / 670 | 3.4% |
| Pacific Beach & Mission Beach | 4 | 3 / 151 | 2.0% |
| Ocean Beach & Point Loma | 8 | 7 / 413 | 1.7% |
Full year 2025: every monitored beach, all test methods
The State file has complete 2025 results for both test methods, so this table includes Mission Bay, La Jolla Cove and other stations tested mainly by ddPCR that are missing from the 12-month ranking.
| Beach | Area | Days above / sampled (2025) | Rate | Last 12 months |
|---|---|---|---|---|
| Imperial Beach pier area | Imperial Beach & border | 301 / 319 | 94.4% | 48 / 50 |
| Imperial Beach municipal beach | Imperial Beach & border | 501 / 539 | 92.9% | 98 / 133 |
| North Imperial Beach | Imperial Beach & border | 294 / 323 | 91.0% | 67 / 98 |
| Tijuana Slough National Wildlife Refuge | Imperial Beach & border | 86 / 135 | 63.7% | 73 / 114 |
| Coronado, Central beach | Coronado & Silver Strand | 92 / 164 | 56.1% | 11 / 22 |
| Silver Strand State Beach | Coronado & Silver Strand | 91 / 181 | 50.3% | 23 / 82 |
| Border Field State Park | Imperial Beach & border | 74 / 154 | 48.1% | 35 / 114 |
| Coronado north beach | Coronado & Silver Strand | 90 / 189 | 47.6% | 10 / 63 |
| La Jolla Cove | La Jolla & Torrey Pines | 24 / 55 | 43.6% | 5 / 10 |
| Mission Bay, Vacation Isle | Mission Bay | 20 / 53 | 37.7% | 1 / 6 |
| Dog Beach, O.B. | Ocean Beach & Point Loma | 31 / 83 | 37.3% | 2 / 45 |
| San Diego Bay (EH-211) | San Diego Bay | 13 / 35 | 37.1% | 0 / 1 |
| Mission Bay (MB-041) | Mission Bay | 13 / 38 | 34.2% | 2 / 4 |
| Mission Bay, Mariners Basin | Mission Bay | 11 / 34 | 32.4% | 0 / 1 |
| Mission Bay, Sail Bay | Mission Bay | 11 / 36 | 30.6% | 0 / 1 |
| Mission Bay (MB-085) | Mission Bay | 9 / 35 | 25.7% | 0 / 1 |
| Mission Bay (MB-100) | Mission Bay | 9 / 36 | 25.0% | 0 / 1 |
| San Diego Bay Glorietta Bay | San Diego Bay | 9 / 37 | 24.3% | 0 / 1 |
| USMC Camp Pendleton | North County | 5 / 21 | 23.8% | 2 / 9 |
| San Dieguito River Beach | North County | 18 / 77 | 23.4% | 2 / 50 |
| Mission Bay, Ventura Cove | Mission Bay | 7 / 34 | 20.6% | 0 / 1 |
| Mission Bay, Campland On The Bay | Mission Bay | 10 / 52 | 19.2% | 0 / 5 |
| Mission Bay, Fanuel Park | Mission Bay | 6 / 32 | 18.8% | 0 / 1 |
| San Onofre State Beach | North County | 3 / 19 | 15.8% | 0 / 7 |
| Mission Bay, Leisure Lagoon | Mission Bay | 5 / 32 | 15.6% | 0 / 1 |
| San Diego Bay Coronado Cays | San Diego Bay | 8 / 53 | 15.1% | 2 / 48 |
| Carlsbad City Beach | North County | 8 / 57 | 14.0% | 2 / 9 |
| Harbor Beach | North County | 20 / 144 | 13.9% | 3 / 54 |
| Cardiff State Beach | North County | 30 / 222 | 13.5% | 5 / 163 |
| Carlsbad State Beach | North County | 6 / 53 | 11.3% | 1 / 9 |
| San Diego Bay (EH-090) | San Diego Bay | 5 / 50 | 10.0% | 1 / 8 |
| South Casa Beach | La Jolla & Torrey Pines | 7 / 78 | 9.0% | 10 / 81 |
| Tourmaline Surfing Park | Pacific Beach & Mission Beach | 10 / 113 | 8.8% | 3 / 58 |
| Torrey Pines State Beach | La Jolla & Torrey Pines | 6 / 72 | 8.3% | 1 / 50 |
| La Jolla Shores Beach | La Jolla & Torrey Pines | 14 / 199 | 7.0% | 6 / 169 |
| Marine Street Beach | La Jolla & Torrey Pines | 3 / 43 | 7.0% | 0 / 39 |
| Mission Bay, De Anza Cove | Mission Bay | 3 / 44 | 6.8% | 0 / 5 |
| Swami's Park | North County | 3 / 51 | 5.9% | 0 / 8 |
| Powerhouse Park 15th Street | North County | 3 / 52 | 5.8% | 1 / 10 |
| Moonlight Beach | North County | 2 / 48 | 4.2% | 5 / 50 |
| Mission Bay (MB-015) | Mission Bay | 1 / 30 | 3.3% | 0 / 1 |
| WindanSea Beach | La Jolla & Torrey Pines | 4 / 123 | 3.3% | 1 / 117 |
| Oceanside Pier area | North County | 2 / 89 | 2.2% | 3 / 55 |
| Buccaneer Beach | North County | 1 / 57 | 1.8% | 3 / 54 |
| Coronado City beaches | Coronado & Silver Strand | 1 / 58 | 1.7% | 4 / 57 |
| Oceanside municipal beach | North County | 3 / 172 | 1.7% | 9 / 162 |
| South Carlsbad State Beach | North County | 5 / 307 | 1.6% | 1 / 240 |
| Ocean Beach | Ocean Beach & Point Loma | 2 / 205 | 1.0% | 4 / 211 |
| Fletcher Cove | North County | 0 / 52 | 0% | 0 / 50 |
| Mission Beach | Pacific Beach & Mission Beach | 0 / 53 | 0% | 0 / 54 |
| Pacific Beach | Pacific Beach & Mission Beach | 0 / 40 | 0% | 0 / 39 |
| Point Loma restricted-access shoreline | Ocean Beach & Point Loma | 0 / 106 | 0% | 1 / 105 |
| San Diego Bay Shelter Is | San Diego Bay | 0 / 43 | 0% | 7 / 50 |
| San Elijo State Beach | North County | 0 / 104 | 0% | 1 / 101 |
| Solana Beach City Beaches | North County | 0 / 52 | 0% | 0 / 50 |
| Sunset Cliffs Park | Ocean Beach & Point Loma | 0 / 53 | 0% | 0 / 52 |
| Whispering Sands Nicholson Point | La Jolla & Torrey Pines | 0 / 40 | 0% | 0 / 39 |
When is San Diego beach water quality worst?
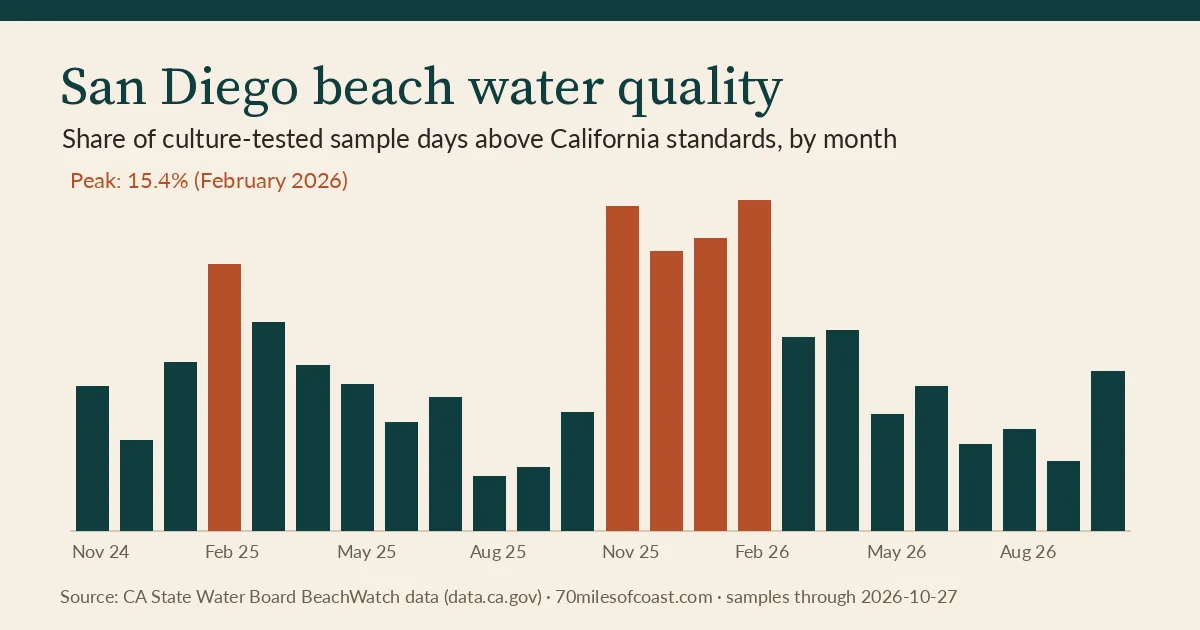
Monthly numbers
| Month | Days above / sampled | Rate |
|---|---|---|
| November 2024 | 11 / 163 | 6.7% |
| December 2024 | 8 / 189 | 4.2% |
| January 2025 | 16 / 205 | 7.8% |
| February 2025 | 21 / 170 | 12.4% |
| March 2025 | 17 / 176 | 9.7% |
| April 2025 | 19 / 247 | 7.7% |
| May 2025 | 17 / 250 | 6.8% |
| June 2025 | 13 / 261 | 5.0% |
| July 2025 | 16 / 256 | 6.2% |
| August 2025 | 6 / 236 | 2.5% |
| September 2025 | 7 / 238 | 2.9% |
| October 2025 | 14 / 253 | 5.5% |
| November 2025 | 26 / 172 | 15.1% |
| December 2025 | 30 / 231 | 13.0% |
| January 2026 | 25 / 184 | 13.6% |
| February 2026 | 29 / 188 | 15.4% |
| March 2026 | 19 / 211 | 9.0% |
| April 2026 | 26 / 280 | 9.3% |
| May 2026 | 14 / 258 | 5.4% |
| June 2026 | 17 / 255 | 6.7% |
| July 2026 | 10 / 252 | 4.0% |
| August 2026 | 12 / 257 | 4.7% |
| September 2026 | 9 / 282 | 3.2% |
| October 2026 | 13 / 176 | 7.4% |
Latest result at every station
Each station’s most recent sample in the State file, compared with the standard. Use these as history, not as today’s status.
North County · 32 stations
| Station | Name in State file | 12 months | 2025 | Latest result vs. standard |
|---|---|---|---|---|
| EH-520 | San Onofre State Beach | 0 / 7 | 3 / 19 | Within standards on Dec 22, 2025 |
| EH-510 | USMC Camp Pendleton | 2 / 9 | 5 / 21 | Within standards on Dec 23, 2025 |
| OC-110 | Harbor Beach | 0 / 7 | 2 / 49 | Within standards on Dec 22, 2025 |
| OC-100 | Harbor Beach | 3 / 47 | 18 / 95 | Within standards on Oct 27, 2026 |
| OC-080 | Oceanside Pier area | 0 / 1 | 2 / 32 | Within standards on Jun 3, 2026 |
| OC-050 | Oceanside Pier area | 3 / 54 | 0 / 57 | Within standards on Oct 19, 2026 |
| OC-040 | Oceanside municipal beach | 2 / 54 | 1 / 57 | Within standards on Oct 19, 2026 |
| OC-022 | Buccaneer Beach | 0 / 0 | 2 / 31 | Within standards on Oct 27, 2025 |
| OC-030 | Buccaneer Beach | 3 / 54 | 1 / 57 | Within standards on Oct 19, 2026 |
| OC-020 | Oceanside municipal beach | 3 / 54 | 1 / 58 | Within standards on Oct 19, 2026 |
| OC-010 | Oceanside municipal beach | 4 / 54 | 1 / 57 | Within standards on Oct 19, 2026 |
| EH-480 | Carlsbad City Beach | 2 / 9 | 8 / 57 | Within standards on Dec 31, 2025 |
| EH-470 | Carlsbad State Beach | 0 / 0 | 0 / 0 | Within standards on Oct 29, 2024 |
| EH-460 | Carlsbad State Beach | 1 / 9 | 6 / 53 | Within standards on Dec 30, 2025 |
| EN-050 | South Carlsbad State Beach | 0 / 46 | 0 / 51 | Within standards on Oct 19, 2026 |
| EN-040 | South Carlsbad State Beach | 0 / 46 | 0 / 51 | Within standards on Oct 19, 2026 |
| EN-030 | South Carlsbad State Beach | 1 / 47 | 1 / 52 | Within standards on Oct 19, 2026 |
| EN-020 | South Carlsbad State Beach | 0 / 47 | 1 / 52 | Within standards on Oct 19, 2026 |
| EN-010 | South Carlsbad State Beach | 0 / 46 | 0 / 51 | Within standards on Oct 19, 2026 |
| EH-440 | South Carlsbad State Beach | 0 / 8 | 3 / 50 | Within standards on Dec 30, 2025 |
| EH-420 | Moonlight Beach | 5 / 50 | 2 / 48 | Within standards on Oct 26, 2026 |
| EH-410 | Swami's Park | 0 / 8 | 3 / 51 | Within standards on Dec 30, 2025 |
| EH-400 | San Elijo State Beach | 0 / 50 | 0 / 52 | Within standards on Oct 20, 2026 |
| SE-070 | San Elijo State Beach | 1 / 51 | 0 / 52 | Within standards on Oct 20, 2026 |
| SE-060 | Cardiff State Beach | 3 / 11 | 19 / 59 | Within standards on Dec 30, 2025 |
| SE-050 | Cardiff State Beach | 1 / 51 | 10 / 58 | Within standards on Oct 20, 2026 |
| SE-040 | Cardiff State Beach | 1 / 51 | 1 / 53 | Within standards on Oct 20, 2026 |
| SE-030 | Cardiff State Beach | 0 / 50 | 0 / 52 | Within standards on Oct 20, 2026 |
| SE-020 | Solana Beach City Beaches | 0 / 50 | 0 / 52 | Within standards on Oct 20, 2026 |
| SE-010 | Fletcher Cove | 0 / 50 | 0 / 52 | Within standards on Oct 20, 2026 |
| EH-380 | San Dieguito River Beach | 2 / 50 | 18 / 77 | Within standards on Oct 20, 2026 |
| EH-360 | Powerhouse Park 15th Street | 1 / 10 | 3 / 52 | Within standards on Dec 31, 2025 |
La Jolla & Torrey Pines · 17 stations
| Station | Name in State file | 12 months | 2025 | Latest result vs. standard |
|---|---|---|---|---|
| FM-100 | Torrey Pines State Beach | 1 / 50 | 6 / 72 | Within standards on Oct 20, 2026 |
| SI-030 | Unnamed station SI-030 (near La Jolla Shores Beach) | 0 / 55 | 0 / 0 | Within standards on Oct 20, 2026 |
| SI-020 | Unnamed station SI-020 (near La Jolla Shores Beach) | 0 / 55 | 0 / 0 | Within standards on Oct 20, 2026 |
| SI-010 | Unnamed station SI-010 (near La Jolla Shores Beach) | 0 / 55 | 0 / 1 | Within standards on Oct 20, 2026 |
| EH-340 | La Jolla Shores Beach | 0 / 40 | 0 / 41 | Within standards on Oct 20, 2026 |
| EH-330 | La Jolla Shores Beach | 0 / 40 | 1 / 41 | Within standards on Oct 20, 2026 |
| EH-320 | La Jolla Shores Beach | 2 / 40 | 1 / 41 | Within standards on Oct 20, 2026 |
| FM-080 | La Jolla Shores Beach | 4 / 49 | 12 / 76 | Within standards on Oct 20, 2026 |
| EH-574 | Unnamed station EH-574 (near La Jolla Shores Beach) | 0 / 0 | 0 / 1 | Within standards on Jun 17, 2025 |
| FM-070 | La Jolla Cove | 5 / 10 | 24 / 55 | Above standard on Dec 31, 2025: Enterococcus DNA (ddPCR) 9,217 copies/100 mL (limit 1,413) |
| EH-310 | South Casa Beach | 10 / 41 | 7 / 38 | Within standards on Oct 20, 2026 |
| EH-305 | South Casa Beach | 0 / 40 | 0 / 40 | Within standards on Oct 20, 2026 |
| EH-300 | Whispering Sands Nicholson Point | 0 / 39 | 0 / 40 | Within standards on Oct 19, 2026 |
| EH-290 | Marine Street Beach source coordinates are inland; not mapped | 0 / 39 | 3 / 43 | Within standards on Oct 19, 2026 |
| FM-050 | WindanSea Beach | 0 / 39 | 1 / 41 | Within standards on Oct 19, 2026 |
| EH-280 | WindanSea Beach | 1 / 39 | 1 / 41 | Within standards on Oct 19, 2026 |
| EH-260 | WindanSea Beach | 0 / 39 | 2 / 41 | Within standards on Oct 19, 2026 |
Pacific Beach & Mission Beach · 4 stations
| Station | Name in State file | 12 months | 2025 | Latest result vs. standard |
|---|---|---|---|---|
| FM-030 | Tourmaline Surfing Park | 3 / 50 | 9 / 94 | Within standards on Oct 19, 2026 |
| EH-254 | Tourmaline Surfing Park | 0 / 8 | 1 / 19 | Within standards on Dec 31, 2025 |
| EH-250 | Pacific Beach | 0 / 39 | 0 / 40 | Within standards on Oct 19, 2026 |
| PL-120 | Mission Beach | 0 / 54 | 0 / 53 | Within standards on Oct 14, 2026 |
Mission Bay · 18 stations
| Station | Name in State file | 12 months | 2025 | Latest result vs. standard |
|---|---|---|---|---|
| MB-070 | Mission Bay, De Anza Cove | 0 / 5 | 3 / 44 | Within standards on Dec 18, 2025 |
| MB-080 | Mission Bay, Campland On The Bay | 0 / 5 | 10 / 52 | Within standards on Dec 18, 2025 |
| MB-120 | Mission Bay, Fanuel Park | 0 / 1 | 6 / 32 | Within standards on Oct 29, 2025 |
| MB-227 | Unnamed station MB-227 (near Mission Bay, Leisure Lagoon) | 6 / 7 | 5 / 5 | Within standards on Jan 11, 2026 |
| MB-085 | Mission Bay | 0 / 1 | 9 / 35 | Within standards on Oct 30, 2025 |
| MB-053 | Mission Bay, Leisure Lagoon | 0 / 1 | 5 / 32 | Within standards on Oct 30, 2025 |
| MB-131 | Mission Bay, Sail Bay | 0 / 1 | 11 / 36 | Within standards on Oct 30, 2025 |
| MB-100 | Mission Bay | 0 / 1 | 9 / 36 | Within standards on Oct 29, 2025 |
| MB-015 | Mission Bay | 0 / 1 | 1 / 30 | Within standards on Oct 30, 2025 |
| MB-205 | Mission Bay, Vacation Isle | 1 / 6 | 20 / 53 | Within standards on Dec 18, 2025 |
| MB-203 | Mission Bay, Vacation Isle | 0 / 0 | 0 / 0 | Within standards on Oct 31, 2024 |
| MB-041 | Mission Bay | 2 / 4 | 13 / 38 | Within standards on Dec 18, 2025 |
| MB-031 | Mission Bay | 1 / 3 | 1 / 3 | Within standards on Dec 18, 2025 |
| MB-223 | Mission Bay, Ventura Cove | 0 / 1 | 7 / 34 | Within standards on Oct 29, 2025 |
| MB-170 | Mission Bay, Mariners Basin | 0 / 1 | 11 / 34 | Within standards on Oct 29, 2025 |
| MB-043 | Unnamed station MB-043 (near Mission Bay) | 2 / 3 | 2 / 3 | Within standards on Dec 18, 2025 |
| MB-226 | Unnamed station MB-226 (near Dog Beach, O.B.) | 0 / 5 | 1 / 44 | Within standards on Dec 18, 2025 |
| MB-115 | Unnamed station MB-115 (near Dog Beach, O.B.) | 1 / 6 | 3 / 46 | Within standards on Dec 18, 2025 |
Ocean Beach & Point Loma · 9 stations
| Station | Name in State file | 12 months | 2025 | Latest result vs. standard |
|---|---|---|---|---|
| FM-010 | Dog Beach, O.B. | 2 / 45 | 31 / 83 | Within standards on Oct 27, 2026 |
| PL-110 | Ocean Beach | 0 / 52 | 2 / 55 | Within standards on Oct 14, 2026 |
| PL-100 | Ocean Beach | 1 / 53 | 0 / 53 | Within standards on Oct 14, 2026 |
| PL-090 | Ocean Beach | 0 / 52 | 0 / 53 | Within standards on Oct 14, 2026 |
| PL-082 | Unnamed station PL-082 (near Ocean Beach) | 0 / 0 | 0 / 8 | Within standards on Feb 19, 2025 |
| PL-080 | Ocean Beach | 3 / 54 | 0 / 44 | Within standards on Oct 14, 2026 |
| PL-070 | Sunset Cliffs Park | 0 / 52 | 0 / 53 | Within standards on Oct 14, 2026 |
| PL-050 | Point Loma restricted-access shoreline | 0 / 52 | 0 / 53 | Within standards on Oct 14, 2026 |
| PL-040 | Point Loma restricted-access shoreline | 1 / 53 | 0 / 53 | Within standards on Oct 14, 2026 |
San Diego Bay · 6 stations
| Station | Name in State file | 12 months | 2025 | Latest result vs. standard |
|---|---|---|---|---|
| EH-200 | San Diego Bay Shelter Is | 7 / 50 | 0 / 43 | Within standards on Oct 19, 2026 |
| EH-211 | San Diego Bay | 0 / 1 | 13 / 35 | Within standards on Oct 30, 2025 |
| EH-070 | San Diego Bay Coronado Cays | 2 / 48 | 8 / 53 | Within standards on Oct 19, 2026 |
| EH-080 | San Diego Bay Glorietta Bay | 0 / 1 | 9 / 37 | Within standards on Oct 28, 2025 |
| EH-090 | San Diego Bay | 1 / 8 | 5 / 50 | Within standards on Dec 23, 2025 |
| EH-120 | San Diego Bay Chula Vista | 0 / 0 | 4 / 31 | Within standards on Oct 27, 2025 |
Coronado & Silver Strand · 9 stations
| Station | Name in State file | 12 months | 2025 | Latest result vs. standard |
|---|---|---|---|---|
| EH-060 | Coronado north beach | 10 / 63 | 90 / 189 | Within standards on Oct 5, 2026 |
| EH-050 | Coronado, Central beach | 11 / 22 | 92 / 164 | Above standard on Dec 31, 2025: Enterococcus DNA (ddPCR) 3,136 copies/100 mL (limit 1,413) |
| IB-080 | Coronado City beaches | 4 / 57 | 1 / 58 | Above standard on Oct 13, 2026: Fecal coliform >12,000 CFU/100 mL (limit 400); Total coliform >16,000 CFU/100 mL (limit 10,000); Enterococcus 1,800 CFU/100 mL (limit 104) |
| IB-079 | Unnamed station IB-079 (near San Diego Bay Glorietta Bay) | 20 / 51 | 165 / 322 | Within standards on Dec 31, 2025 |
| IB-069 | Unnamed station IB-069 (near Silver Strand State Beach) | 16 / 29 | 98 / 141 | Within standards on Dec 23, 2025 |
| EH-576 | Unnamed station EH-576 (near Silver Strand State Beach) | 0 / 0 | 0 / 1 | Within standards on Jul 1, 2025 |
| IB-070 | Silver Strand State Beach | 23 / 82 | 91 / 181 | Above standard on Oct 13, 2026: Fecal coliform >12,000 CFU/100 mL (limit 400); Total coliform >16,000 CFU/100 mL (limit 10,000); Enterococcus 2,800 CFU/100 mL (limit 104) |
| EH-575 | Unnamed station EH-575 (near Silver Strand State Beach) | 0 / 0 | 0 / 1 | Within standards on Jul 1, 2025 |
| IB-068 | Unnamed station IB-068 (near Silver Strand State Beach) | 34 / 50 | 227 / 320 | Above standard on Dec 31, 2025: Enterococcus DNA (ddPCR) 8,918 copies/100 mL (limit 1,413) |
Imperial Beach & border · 8 stations
| Station | Name in State file | 12 months | 2025 | Latest result vs. standard |
|---|---|---|---|---|
| IB-060 | North Imperial Beach | 67 / 98 | 294 / 323 | Above standard on Oct 13, 2026: Fecal coliform 3,600 CFU/100 mL (limit 400); Total coliform >16,000 CFU/100 mL (limit 10,000); Enterococcus 1,400 CFU/100 mL (limit 104) |
| EH-030 | Imperial Beach pier area | 48 / 50 | 301 / 319 | Above standard on Dec 31, 2025: Enterococcus DNA (ddPCR) 315,863 copies/100 mL (limit 1,413) |
| EH-010 | Imperial Beach municipal beach | 40 / 43 | 259 / 276 | Above standard on Dec 31, 2025: Enterococcus DNA (ddPCR) 273,385 copies/100 mL (limit 1,413) |
| IB-050 | Imperial Beach municipal beach | 58 / 90 | 242 / 263 | Above standard on Oct 13, 2026: Fecal coliform 1,600 CFU/100 mL (limit 400); Enterococcus 540 CFU/100 mL (limit 104); Total coliform coliform (fecal:total ratio 0.19) 8,400 per 100 mL (limit 1,000) |
| IB-040 | Tijuana Slough National Wildlife Refuge | 31 / 57 | 27 / 58 | Above standard on Oct 13, 2026: Fecal coliform 1,800 CFU/100 mL (limit 400); Enterococcus 500 CFU/100 mL (limit 104); Total coliform coliform (fecal:total ratio 0.20) 9,000 per 100 mL (limit 1,000) |
| IB-030 | Tijuana Slough National Wildlife Refuge | 42 / 57 | 59 / 77 | Above standard on Oct 13, 2026: Fecal coliform 8,000 CFU/100 mL (limit 400); Total coliform >16,000 CFU/100 mL (limit 10,000); Enterococcus 1,800 CFU/100 mL (limit 104) |
| IB-020 | Border Field State Park | 18 / 57 | 39 / 77 | Above standard on Oct 13, 2026: Enterococcus 460 CFU/100 mL (limit 104); Total coliform coliform (fecal:total ratio 0.14) 2,400 per 100 mL (limit 1,000) |
| IB-010 | Border Field State Park | 17 / 57 | 35 / 77 | Above standard on Oct 13, 2026: Fecal coliform 780 CFU/100 mL (limit 400); Enterococcus 640 CFU/100 mL (limit 104); Total coliform coliform (fecal:total ratio 0.16) 5,000 per 100 mL (limit 1,000) |
Tides at the nearest NOAA station
Every beach above is paired with its nearest NOAA tide-prediction station (open-coast beaches with an open-coast station, bay beaches with a bay station). See the 7-day San Diego tide chart for all five, and tide-pool guides for low-tide trips.
La Jolla (Scripps Pier) · NOAA station 9410230
Predicted highs & lows · feet MLLW · Pacific time
↑ High tide ↓ Low tide
Predictions, not observed conditions. NOAA ↗
Questions about San Diego beach water quality
Is the water safe to swim in San Diego today?
This page cannot tell you; it summarizes past laboratory samples. The County of San Diego posts current advisories, warnings and closures at sdbeachinfo.com. After about 0.2 inch of rain, the County advises avoiding ocean and bay water contact for 72 hours after the rain ends.
Which San Diego beaches had the most bacteria exceedances?
In the 12 months to October 27, 2026, the highest rates among regularly sampled beaches were Imperial Beach municipal beach (73.7%, 98 of 133 days); North Imperial Beach (68.4%, 67 of 98 days); Tijuana Slough National Wildlife Refuge (64.0%, 73 of 114 days).
Which San Diego beaches had the cleanest water?
7 regularly sampled beaches had no sample above a state standard in the 12 months to October 27, 2026: Mission Beach, Sunset Cliffs Park, Fletcher Cove, Solana Beach City Beaches, Marine Street Beach, Pacific Beach, Whispering Sands Nicholson Point.
What counts as an exceedance?
A sample day counts when any result is above a California single-sample standard: 104 Enterococcus, 400 fecal coliform or 10,000 total coliform per 100 mL (1,000 when the fecal-to-total ratio is above 0.1), or 1,413 Enterococcus DNA copies per 100 mL for the County's ddPCR test.
How often is this page updated?
Monthly, from the State Water Board's BeachWatch file on data.ca.gov. That file lags the County's own daily postings; it currently runs through October 27, 2026, and ddPCR results run through December 31, 2025.
Method and sources
Source: California State Water Resources Control Board — Surface Water Fecal Indicator Bacteria Monitoring Results (data.ca.gov), Project “BeachWatch_San Diego County”. Samples collected by the County of San Diego Department of Environmental Health and Quality (DEHQ) and reported to the State's BeachWatch system. Pulled November 19, 2026 via the data.ca.gov CKAN API (23,729 records from Oct 28, 2024; the State file was last modified Nov 18, 2026).
Standards (single sample, per 100 mL; 17 CCR § 7958, County ddPCR threshold):
- Total coliform: more than 10,000 per 100 mL (culture)
- Fecal coliform: more than 400 per 100 mL (culture)
- Enterococcus: more than 104 per 100 mL (culture)
- Total coliform when fecal:total ratio > 0.1: more than 1,000 per 100 mL (culture)
- Enterococcus DNA (ddPCR): more than 1,413 DNA copies per 100 mL
Method: A sample is one station on one sample date. It counts as an exceedance when any reported result that day is above a California single-sample standard (17 CCR 7958) or, for ddPCR Enterococcus DNA, above the County's 1,413 copies/100 mL threshold. Results reported as below detection ('<') never count; results reported as greater than a lab maximum ('>') count when that value is at or above the limit. Exceedance rate = exceedance days / sample days in the 12 months ending on the newest sample date in the State file. Beaches group stations whose source name is identical. Baja California stations and E. coli results (no single-sample standard) are excluded. Ranked beaches need at least 10 sample days spread over at least 270 days of the 12-month window.
Caveats: Bacteria samples are point-in-time; water can change within hours, and lab results arrive after sampling. Rates depend on how often a station is sampled: the County samples more often when water is already under advisory, so heavily sampled beaches can look worse than a once-a-week schedule would. The State file carries ddPCR (DNA) results only through December 31, 2025; stations tested only by ddPCR therefore have partial 12-month data and are listed in the 2025 table instead of the ranking (Imperial Beach pier area, Coronado, Central beach, Carlsbad City Beach, La Jolla Cove, Mission Bay, Vacation Isle, Carlsbad State Beach, Powerhouse Park 15th Street, Mission Bay, Campland On The Bay, Swami's Park, San Diego Bay (EH-090), Mission Bay, De Anza Cove, Mission Bay (MB-041), San Diego Bay Glorietta Bay, Mission Bay (MB-100), Mission Bay, Sail Bay, Mission Bay (MB-085), San Diego Bay (EH-211), Mission Bay, Mariners Basin, Mission Bay, Ventura Cove, Mission Bay, Fanuel Park, Mission Bay, Leisure Lagoon, Mission Bay (MB-015)). ddPCR and culture tests can disagree on the same day. Results are as reported to the State; we do not correct them, except that one station whose coordinates fall inland (EH-290) is left off the map. Baja California stations are excluded. Tide predictions come from NOAA CO-OPS; they are not surf or safety forecasts.
Download the station table (CSV) · Updated November 2026.
Planning a beach day? Browse San Diego beach guides, La Jolla Shores, Torrey Pines State Beach and Coronado.